2016
Dhungel, R., Allen, R.G., Trezza, R., & Robison, C.W. (2016). Evapotranspiration between satellite overpasses: methodology and case study in agricultural dominant semi-arid areas. Meteorological Applications, 23(4), 714–730. DOI ↗
 BAITSSS
This page follows the BAITSSS model: where the model came from, how the research evolved across institutions and applications, and where that work appears in the peer-reviewed literature.
Field processes continue between satellite observations. The BAITSSS model was developed to carry the water and energy balance through those intervals using remote sensing, weather, vegetation information, soil properties, and management assumptions.
This visual set follows major stages of the BAITSSS model record: development between satellite overpasses, independent ET evaluation, landscape-scale water-allocation analysis, and citrus ET intercomparison.
Question: How can ET be represented through the interval between satellite observation dates while retaining field-scale spatial information?
The paper introduced the BAITSSS model framework for carrying surface energy and soil-water states between satellite overpasses.
Open DOI →Question: How does the BAITSSS model perform without prior site calibration when compared with independent ET and surface measurements under strongly advective conditions?
The study used a 127-day corn growing season and compared simulated ET with weighing-lysimeter observations.
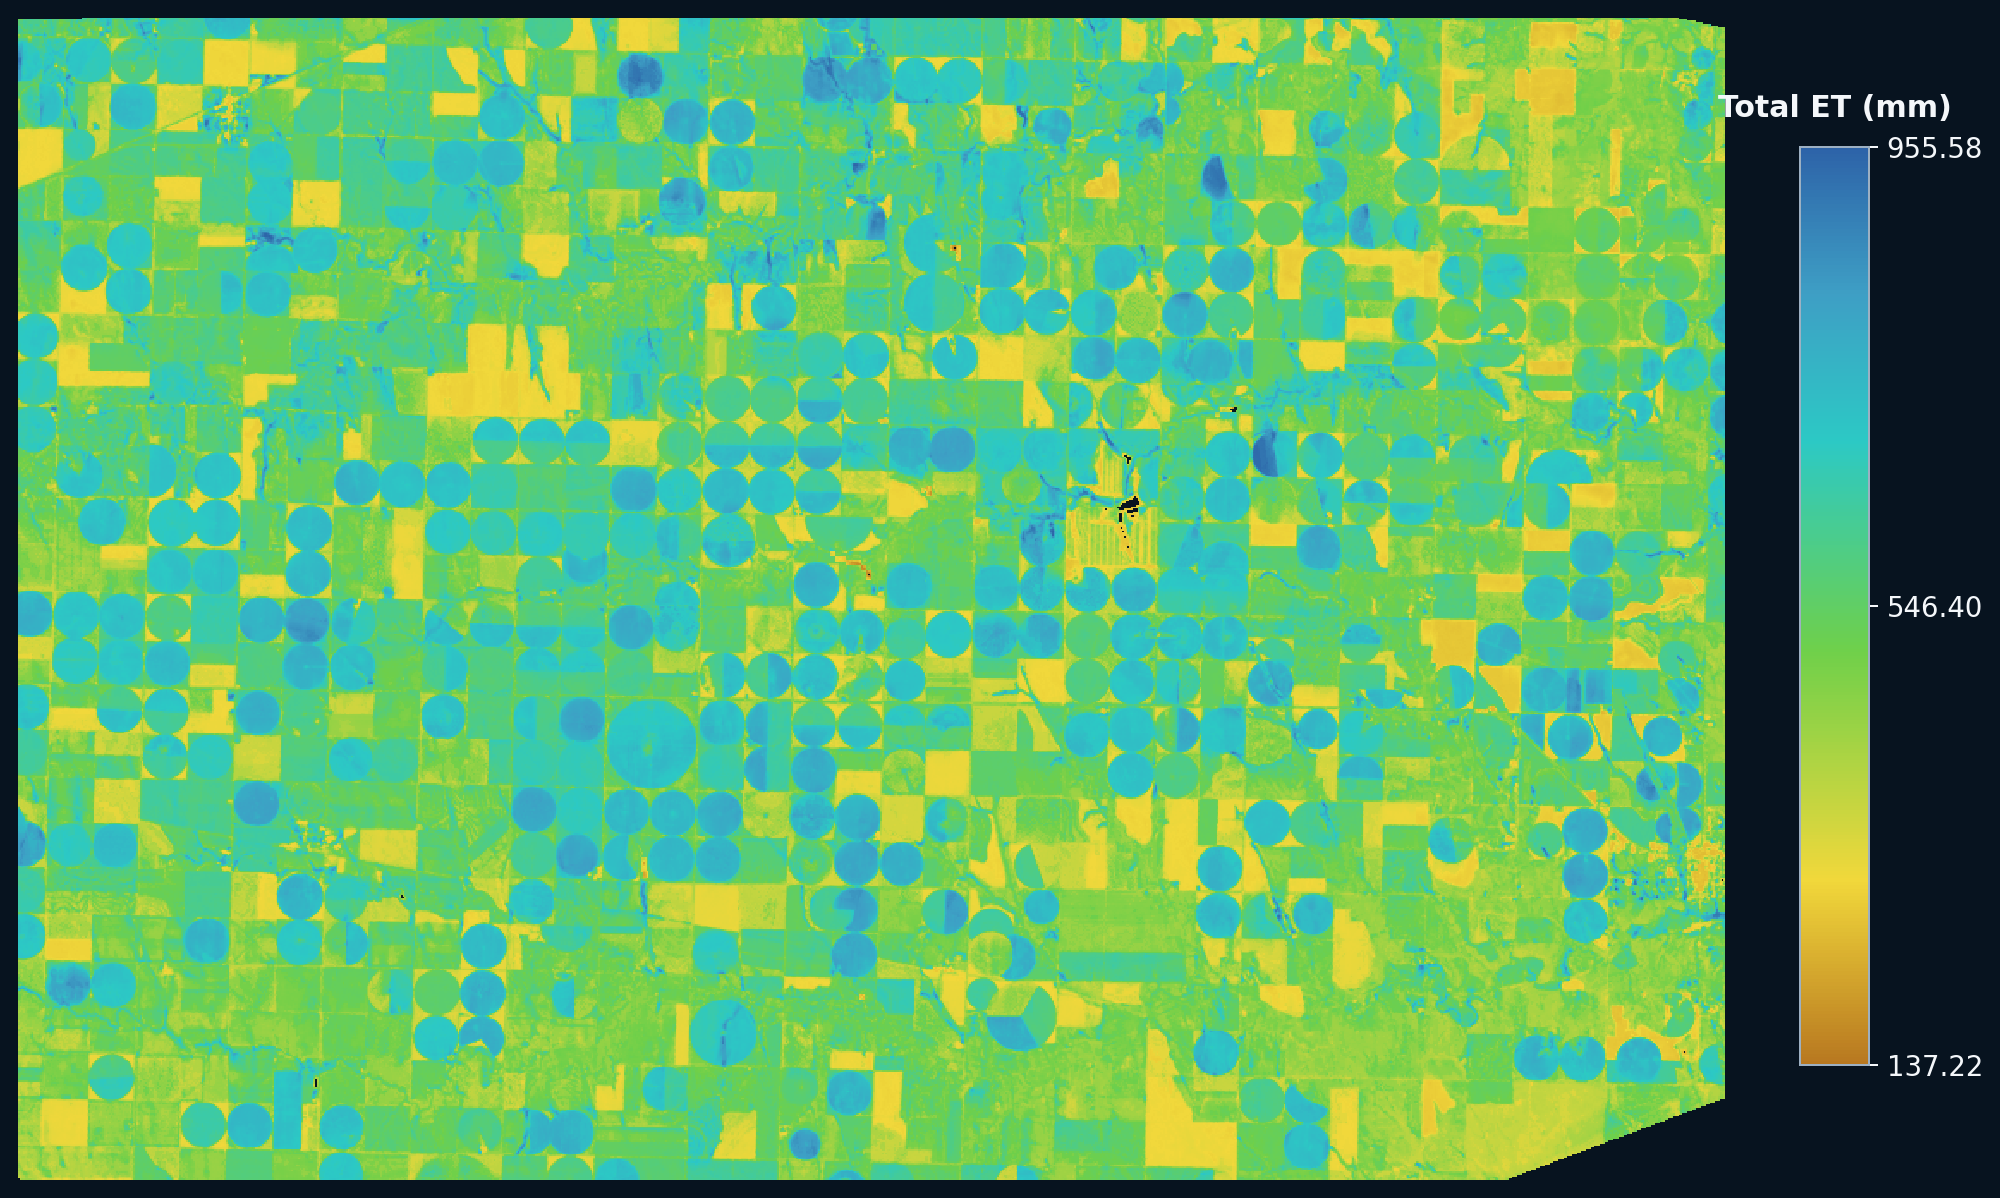
Question: How can landscape-scale energy-balance simulation be used to examine changes in agricultural water application under restricted allocations?
The study covered two groundwater regions during 2013–2017 and compared simulated irrigation with reported irrigation within water-right management units.
Open DOI →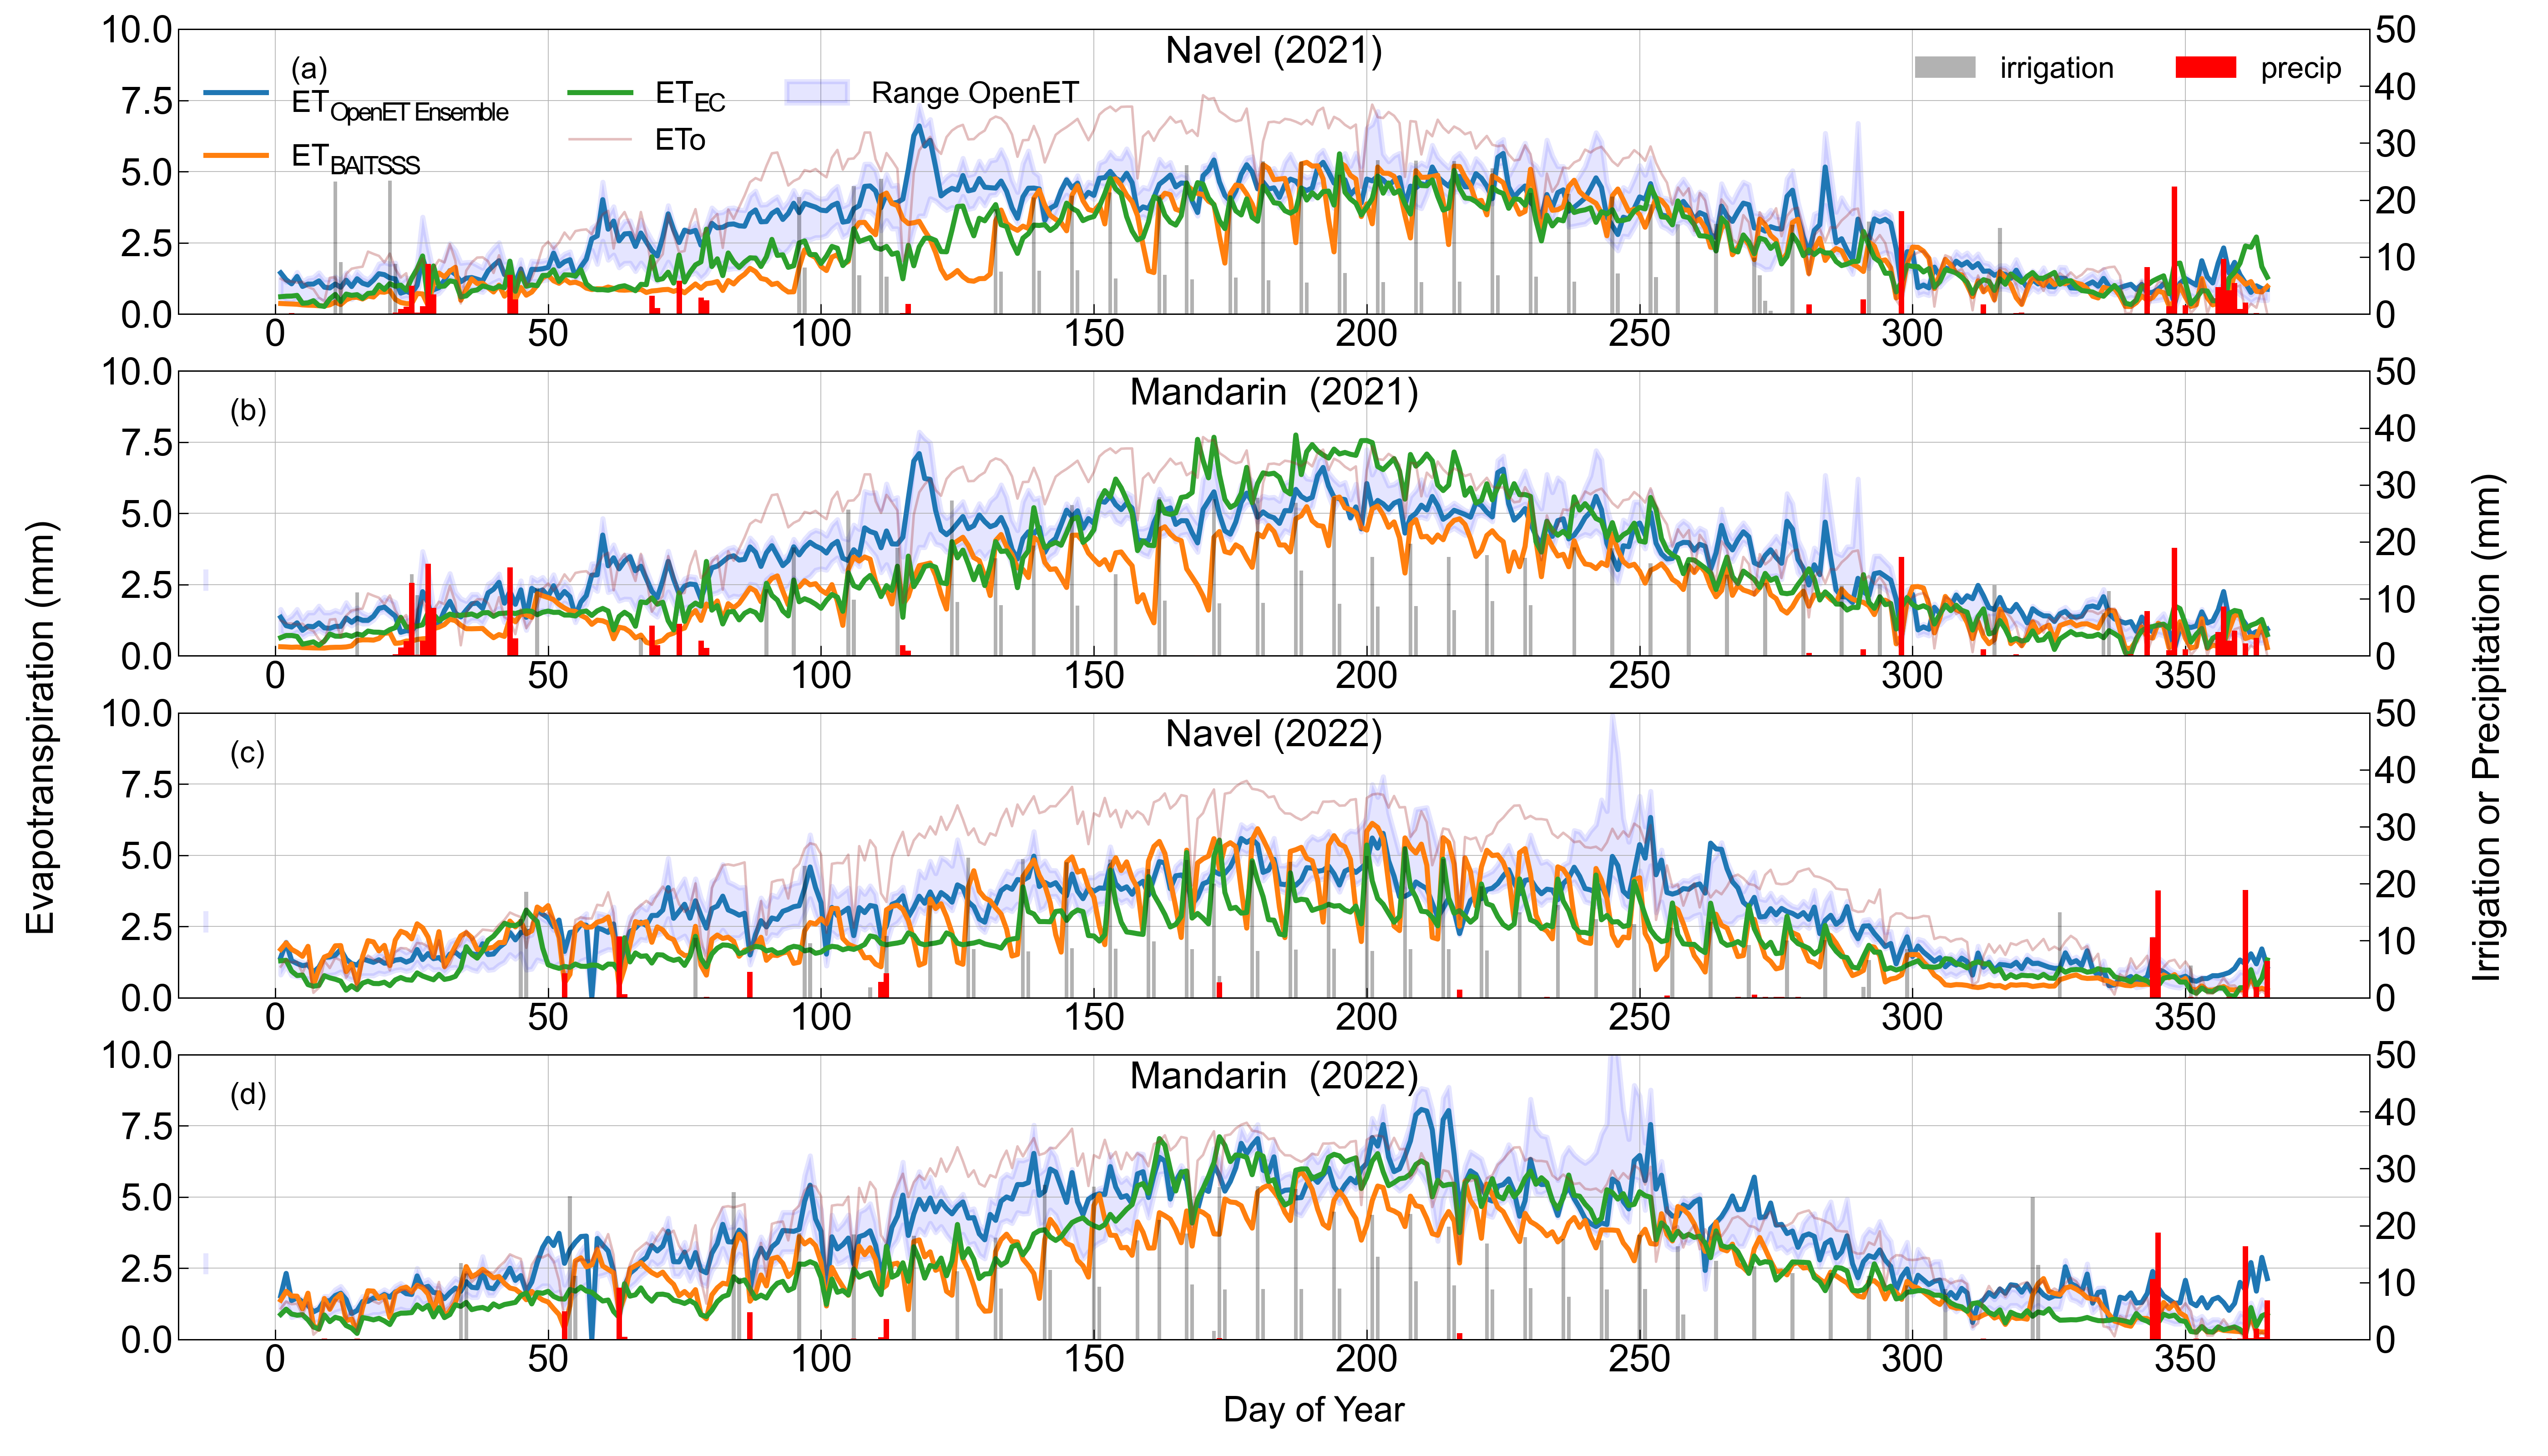
Question: How do BAITSSS model and OpenET ET estimates compare with eddy covariance observations and water received in citrus orchards?
The study evaluated navel and mandarin orchards over 2021–2022. BAITSSS model ET results were generated using actual irrigation records rather than model-simulated irrigation.
A 2020 ASABE irrigation-symposium paper summarized field comparisons and irrigation-management experiments from the BAITSSS model research program. The figures below redraw reported values rather than reproduce the original journal or conference artwork.
The published synthesis reports comparisons between 22 May and 26 September 2016 under advective field conditions.
A representative 30 m pixel was used to examine irrigation-system and MAD settings for a corn growing season from 10 May to 15 September.
The same published synthesis shows a center-pivot example in SD-6 LEMA where seasonal vegetation patterns corresponded with three broad categories of simulated cumulative irrigation.
The published discussion relates these spatial differences primarily to seasonal and pixel-scale vegetation variation, with additional influence from soil water-holding characteristics. The authors also note that these simulated spatial patterns could not be fully verified against actual within-pivot irrigation conditions.
The BAITSSS model can be used to examine how different soil representations influence soil-water behavior, evapotranspiration components, and modeled irrigation at the same location.
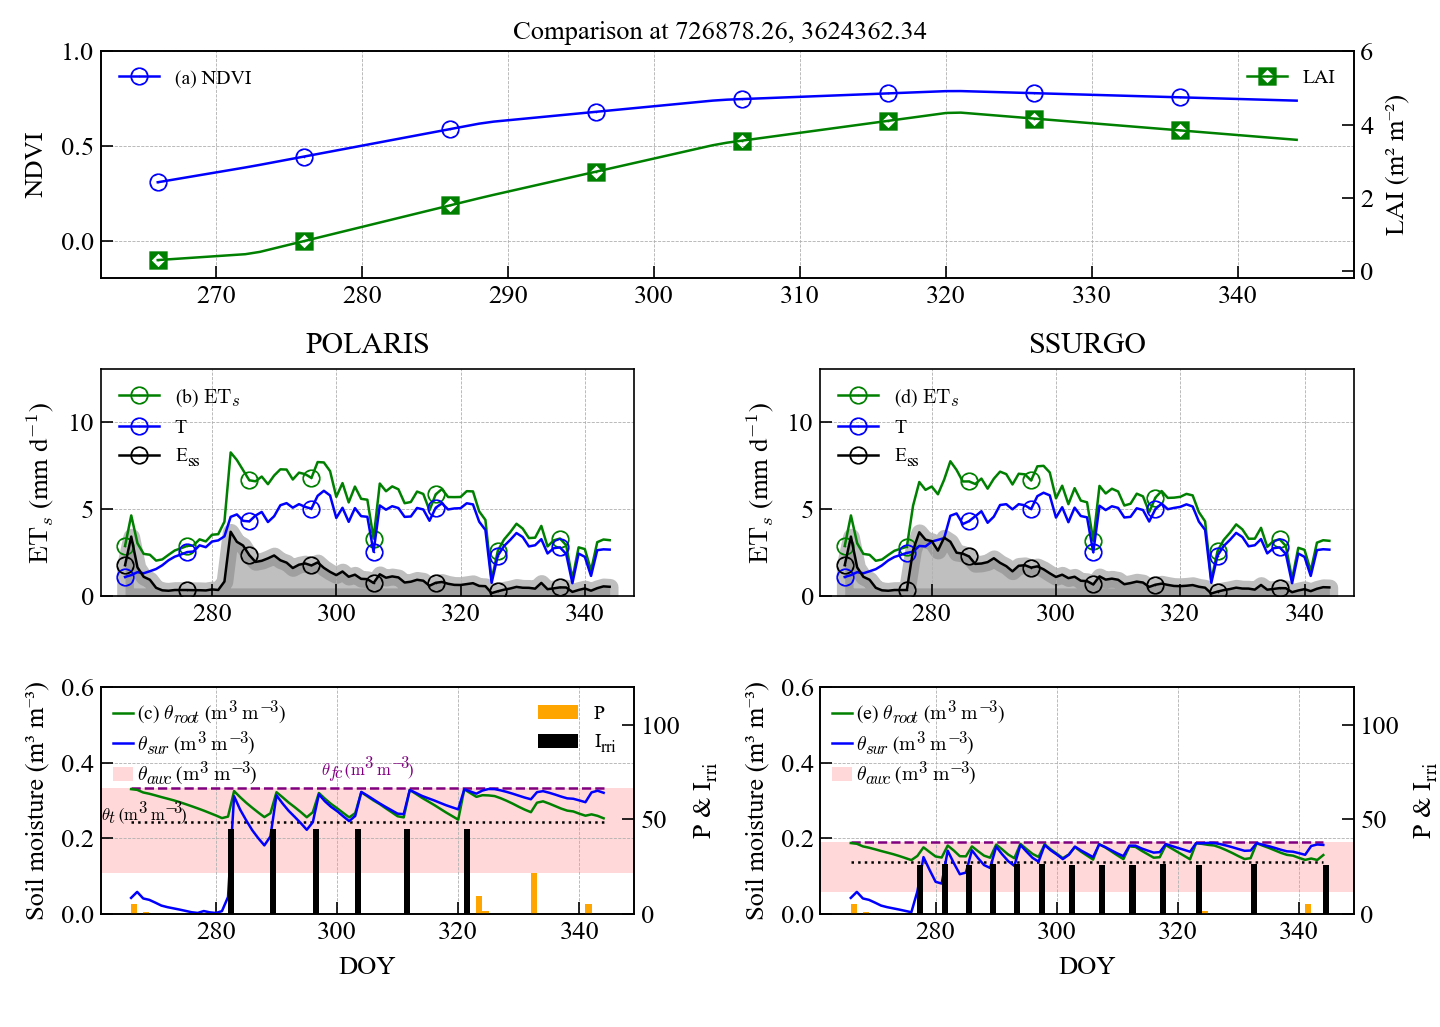
The vegetation trajectory is held in common while the BAITSSS model is evaluated with POLARIS and SSURGO soil representations.
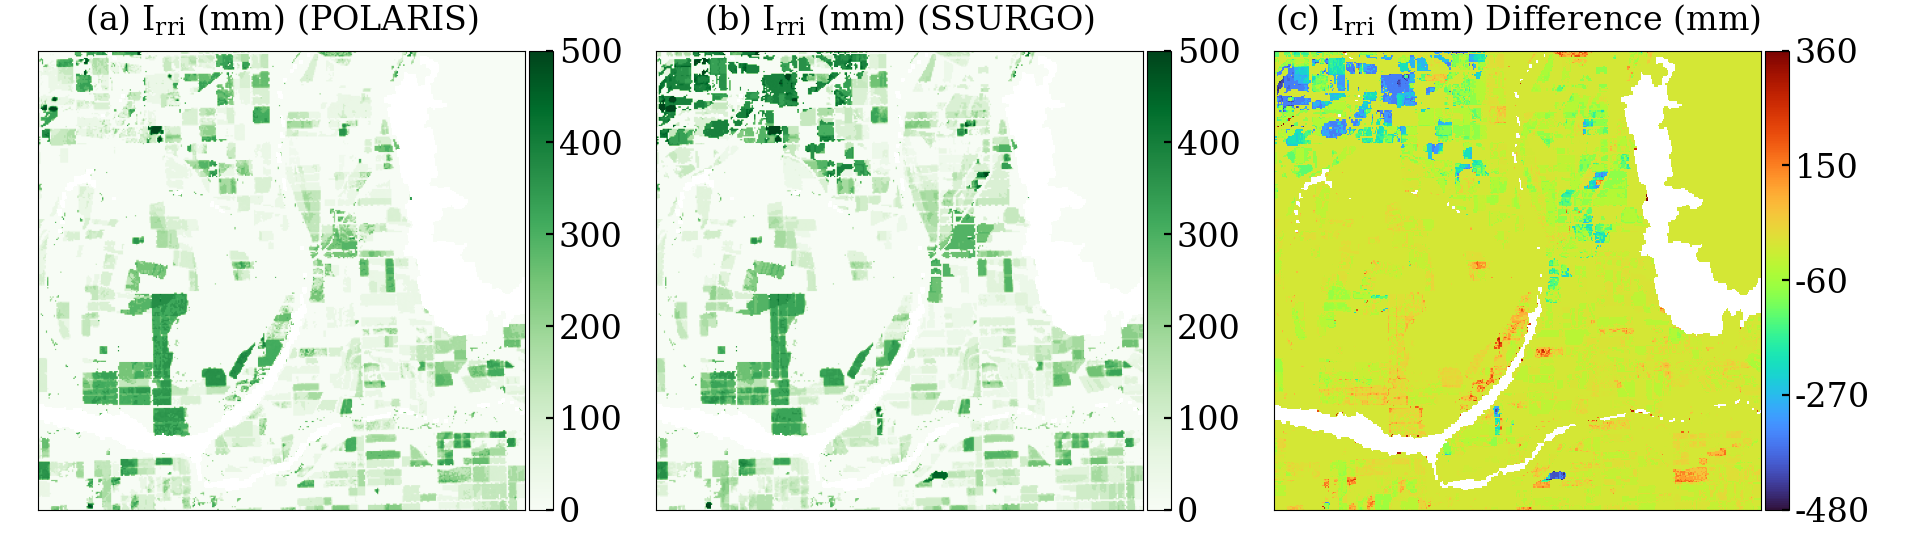
Different soil representations produce different modeled irrigation timing and frequency.
Together, the figures show that differences in soil representation can propagate into different root-zone water behavior and irrigation response while the vegetation trajectory remains the same.
The map shows only numbered study markers. The matching index below carries the study description, coordinate information, and DOI so the geography stays clean and readable.

Published BAITSSS model study area near American Falls, Idaho; shown as an area because the paper does not provide one exact site coordinate.
Open DOI →Published BAITSSS model study area in San Joaquin County, California; shown at regional scale rather than as an invented point.
Open DOI →Two documented commercial citrus study sites near Visalia, California, approximately 15 km apart.
Open DOI →Documented BAITSSS model study locations in the Yuma Valley and Bard agricultural region.
Open DOI →Documented BAITSSS model research area in northwest Kansas, including the Sheridan 6 region.
Open DOI →Documented USDA-ARS field site at Bushland, Texas, with the published coordinate shown below.
The timeline records when documented BAITSSS model study locations entered the public research record. Scientific findings remain in the published studies above and in the cited papers.
Methodology study areas near American Falls and in San Joaquin County.
Documented field-evaluation site.
Documented landscape-scale application region.
Documented agricultural study locations in Arizona and California.
Documented commercial citrus study sites.
This separation is central to interpreting BAITSSS model results correctly.
| Evidence category | Question answered | Primary authority | Public record |
|---|---|---|---|
| Peer-reviewed scientific evaluation | How did the model perform under the sites, observations, periods, and methods described in the study? | Published measurements, comparison datasets, methods, and peer-reviewed analysis | Published |
| Numerical equivalence | Does a changed execution route reproduce the accepted scientific reference within defined numerical criteria? | Accepted reference implementation and controlled test cases | Software verification |
| Checkpoint and lifecycle testing | Can a run stop, resume, restart, and preserve intended execution state? | Controlled software tests and run records | Software verification |
| Performance benchmarking | How long does a defined computation take under a stated hardware and workload configuration? | Measured execution time for specified test cases | Engineering evidence |
| Independent scientific comparison | How do BAITSSS model outputs compare with independent observations or products at the relevant spatial and temporal scale? | Field measurements, thermal observations, ET products, soil-water observations, and irrigation records | Ongoing evaluation |
The BAITSSS model has a peer-reviewed publication record covering defined study sites, climates, crops, observations, input sources, and experimental conditions.
The publication itself is the authority for the numerical result, study design, comparison method, and stated limitation.
View publications →A result from one site or period should not be generalized automatically to every field. Scientific performance must be interpreted in the conditions under which the evaluation was performed.
Accuracy and interpretation FAQ →These tests address whether BAITSSS Desktop executes the intended BAITSSS model scientific workflow reliably. They are not substitutes for field validation.
BAITSSS Desktop execution methods are compared with the accepted BAITSSS model scientific reference under controlled conditions and defined numerical criteria.
Stop, resume, restart, and run-lifecycle behavior are tested separately so continuity of scientific state is not assumed from interface behavior.
BAITSSS Desktop project inputs, run configuration, software state, outputs, and execution records are preserved so a result can be traced back to the run that produced it.
Runtime is meaningful only with the size of the simulated area, number of model hours, execution configuration, and computer used for the test.
Current performance observations →A faster execution route is useful only if the scientific state and outputs remain consistent with the accepted reference under the defined verification criteria.
Thermal observations, ET products, field measurements, soil-water observations, and irrigation records can provide independent comparisons. Spatial scale, temporal scale, measurement uncertainty, and management conditions must be considered before interpreting differences.
Resistance connectivity, parameter sensitivity, stability, assumptions, and transferability remain subjects of scientific evaluation rather than being treated as fixed proof of performance everywhere.